


Data coverage is often an overlooked yet critical aspect of software delivery.
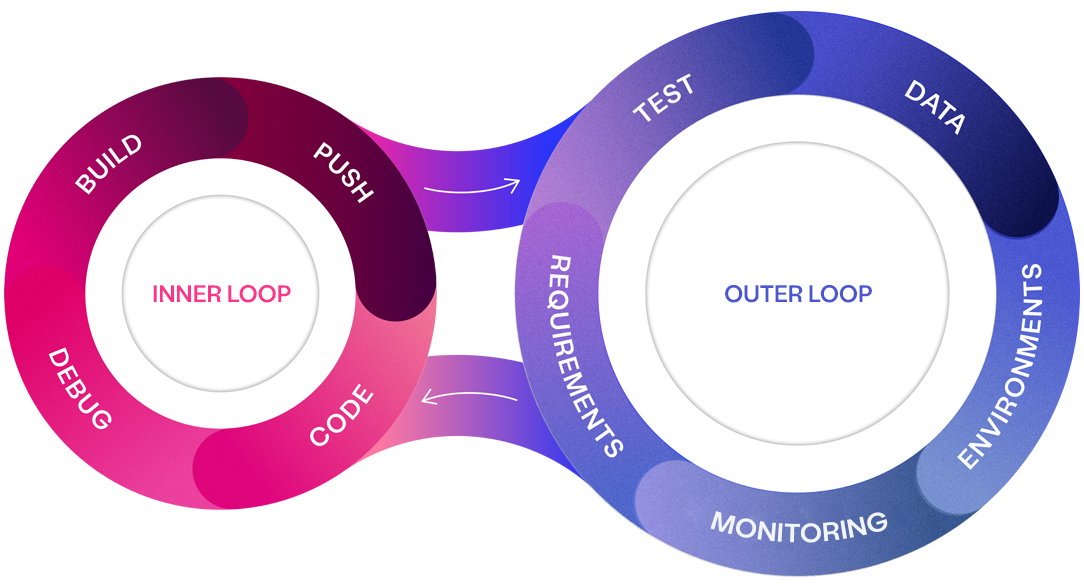
There's a well-known saying in the industry - "You can only test as well as the data you have available". This highlights the reality that even the most robust processes, teams and tools are limited by the data they have available – impacting quality. A challenge we often see in organisations with low productivity is teams frequently spending a considerable amount of time either waiting for data to be created or manually assembling it, which slows down the entire delivery process across both inner and outer loops.
Ensuring comprehensive data coverage is essential for any organisation aiming to enhance both quality and productivity.
What is data coverage?
Data coverage refers to the extent to which data captures the full range of scenarios a system might encounter, including edge cases and unexpected conditions. In simpler terms, it’s about ensuring that your data is not limited to only the common or ideal paths, but also cover those less frequent and unusual situations.
Imagine data coverage as the difference between looking through a single lens versus using a wide-angle lens. With a narrow, single lens, you can only see a limited portion of what’s in front of you—this is similar to undertaking high-value tasks (such as development & testing) with incomplete data, where only the most common or expected scenarios are present. On the other hand, a wide-angle lens lets you see the full landscape, capturing details at the edges that might otherwise go unnoticed. This broader view represents comprehensive data coverage, where all possible scenarios—including those that are less frequent or hard to predict—are accounted for in your data.

A wide-angle lens vs. a single lens. Low data coverage contains a snippet of actual data scenarios and combinations. High covered data represents a much wider portion of what’s available.
Why data coverage matters?
Low data coverage leaves significant gaps when developing and testing applications. These unavailable scenarios allow bugs and errors to slip through leading to system failures or performance issues when the application is deployed. The core symptoms we often observe in teams with low coverage are -
Poor quality
When developers, and testers rely on a limited dataset, it only covers common scenarios, leaving out edge cases and unexpected conditions. As a result, significant issues may go undetected until the software is live. This leads to bugs, performance problems, and system crashes in production, forcing teams to revisit code, fix errors, and re-test, creating a cycle of costly rework.
Low productivity
Limited data availability is a major bottleneck for teams. Without adequate test data, teams often must wait for data to be created, or they spend significant time manually assembling data. This waiting period slows down the entire delivery pipeline, reducing team productivity and delaying releases. Even when production data is used, it often lacks the diversity needed for comprehensive testing, as production data typically includes repetitive, "common" scenarios rather than edge cases.
What is good data coverage?
Good data coverage goes beyond simple “happy scenarios” where everything works as expected under ideal conditions. To achieve comprehensive coverage, teams must include edge cases, failure scenarios, and stress conditions in their data. This ensures that the data fully represents the underlying logic in the system not only under normal usage but also when faced with a much wider array of events, such as, negative scenarios.
Data visualisation is a critical tool in understanding data coverage. It allows us to analyse and inspect the data to understand what is available in our systems today along with the gaps. The following chart is a spot diagram which can be used to compare data coverage across different scenarios (happy paths, edge cases, and unexpected conditions). This specific scenario compares credit card approvals, against credit ratings. The graph indicates that we have a sparse data set. That is, we only have data for some combinations (i.e., loan rejection across fair, excellent, and average ratings, along with, loan approval with good credit), there is a lot of data combinations missing (such as, loan approval across fair, average, and excellent ratings).

A spot diagram of credit history vs. loan approval outcome.
Low data coverage leaves gaps in testing edge cases and unexpected conditions. In the following example, we can only develop and test our algorithm for approving loans against one approval scenario, when a person has good credit history. We don’t have any data for the other scenarios, and therefore can’t test or develop against them. In contrast, if we had a high data coverage which distributes test data more evenly, ensuring that all types of scenarios are available, developers and testers can leverage a much richer dataset to achieve optimal outcomes (quality and productivity).
A Criteria for data coverage
It’s important to focus on specific qualities that lead to better outcomes in software delivery. Here are some key criteria that define good data coverage:
-
Including edge cases, and negative scenarios
High-quality data coverage means data with the full spectrum of potential conditions, from common scenarios to rare or extreme cases. For example, edge cases might involve unusually long input values, rare system configurations, or boundary conditions in calculations. Negative scenarios represent how the system handles invalid data, errors, or partial failures.
By covering these scenarios, teams can ensure that the system behaves correctly in any situation, avoiding the risk of unexpected failures in production.
-
Characteristics of high-quality data coverage
Good data coverage has several key underlying characteristics:
- Completeness: The test data must cover all relevant aspects of the system, including different user inputs, data sources, and system behaviours. This ensures that no area is left untested.
- Relevance: Test data must be closely aligned with real-world use cases, reflecting the scenarios the system will encounter when deployed.
- Compliance: Particularly in industries like finance and healthcare, test data must comply with privacy regulations, such as GDPR or HIPAA, to ensure that sensitive information is protected.
Achieving these qualities ensures that the test data is robust, meaningful, and compliant with regulations, minimizing the risk of defects or compliance breaches.
-
Capturing a wide range of scenarios, not just more data
Good data coverage isn’t about simply generating large volumes of data—it’s about ensuring diversity in the data. Huge datasets that only cover common scenarios is of limited value. Instead, the goal is to generate test data that captures a wide range of possible conditions the system may encounter.
For example, instead of repeatedly holding the same input values or user flows, good data coverage ensures that variations in user behaviour, environmental factors, and system states are all represented in the test data.
-
Focusing on risk
Achieving full data coverage for every possible scenario is impossible due to the complexity of modern systems. Therefore, focusing on high-risk areas of the system is a more practical approach. By identifying and prioritising these high-risk components, teams can strategically allocate resources to ensure comprehensive coverage where it matters most. This involves controlling specific parameters, such as key inputs, configurations, or behaviours that have a higher potential for failure. Even with limited time or resources, the most important parts of the system have a high level of coverage to support all the core tasks required across software delivery, therefore minimising the chances of critical issues slipping through, and keeping teams productive.
Approaches leading to poor data coverage
Many legacy test data management (TDM) practices and techniques persist across the industry which ultimately hinder data coverage. Achieving comprehensive data coverage requires a range of modern tools and techniques (e.g. Enterprise Test Data). Below are several common approaches that contribute to inadequate coverage, resulting in reduced software quality and lower team efficiency.
-
A reliance on production test data
Copying raw or masked production data is simply not good enough for achieving high data coverage. This is because production data rarely covers negative scenarios, edge cases, or data to test new functionality. By contrast, high-coverage requires a spectrum of data combinations.

Low-variety production data copies rarely contain the data combinations needed for data-coverage.
-
Slow and manual data refreshes
Manually copying complex data across environments and systems is slow and error-prone, often breaking relationships in the data. Furthermore, databases are likely to change during refreshes, which causes data sets to become unaligned.
Out-of-date and misaligned data in turn undermines data coverage and causes time-consuming test failures. In fact, 61% of respondents in the latest World Quality Report cite “maintaining test data consistency across different systems under test” as a test data challenge.
-
Crude data subsetting
Subsetting test data is valuable for lowering storage costs, data provisioning time, and the time required to execute tests. However, simplistic subsetting techniques can damage both the relationships and coverage of data.
For instance, simply taking the first 1000 rows of each table will not respect the relationships between data that exists across tables. Nor will it typically provide the data needed to execute every test in a suite.
-
Manual data creation
To boost test coverage, testers are often required to manually create the complex data needed to fulfil their tasks. However, manual data creation is time-consuming and error-prone, often creating inconsistent or incorrect data that causes time-consuming delays which hinder productivity.
-
Data masking
Data masking is another widely adopted technique, where sensitive information from production data is obfuscated for use in lower environments. While this provides realistic data for testing, it often lacks diversity, focusing mainly on common scenarios and leaving out critical edge cases. Additionally, masking can be a complex process that must ensure compliance with privacy regulations, such as GDPR or HIPAA. However, even with robust masking, production data is often repetitive and does not always provide the full variety needed for comprehensive data coverage.
-
AI-Based generation
AI-based generation leverages machine learning algorithms to automatically create diverse and realistic data by analysing existing patterns and behaviours within a system. While recent techniques can build AI models from production data to mimic its characteristics, they often inherit the same limitations as using production data directly.
Like data masking, AI-generated data may address compliance concerns by ensuring sensitive information is not exposed. However, it still suffers from the same issue: production data tends to be repetitive and focuses heavily on common scenarios. As a result, while AI-generated data might seem innovative, it often lacks the diversity needed for comprehensive coverage, particularly when it comes to edge cases and unusual scenarios.
Visual modelling: A powerful approach to achieve data coverage
Visual modelling is a powerful method for enhancing data coverage by allowing teams to graphically represent complex systems and data flows. Instead of relying on manual processes to define data sets, visual models create a dynamic, visual representation of how systems work, the relationships between different components, and the flow of data across the system. This provides a clearer, more intuitive understanding of the data scenarios, making it easier to identify gaps in data, and areas where more comprehensive data is needed.
One of the key advantages of visual modelling is the ability to embed business logic directly into the data creation process. By capturing business rules and system behaviours within the visual model, teams can ensure that all necessary data scenarios, including edge cases and failure conditions, are accounted for. This approach generates data in line with the actual requirements and logic that govern real-world use cases. In essence, visual models act as a blueprint for the system, allowing teams to populate test data that accurately mirrors all the possible behaviours and business logic that can be embedded to achieve full data coverage.

A segment of a visual model representing a user agreement for phone insurance.
Furthermore, visual modelling offers flexibility in handling a variety of data types and formats. Whether the system relies on relational databases, NoSQL, XML, or JSON, visual models can generate data in the appropriate format to support different architectures, along with provisioning data into different environments. This ensures data coverage is comprehensive across all layers of the technology stack, even if it exists across disjoined systems and environments.
By automating the creation of test data through model-based testing, visual modelling provides a powerful solution to ensure thorough data coverage, reducing the time spent manually preparing data while increasing data coverage. It’s an essential tool for organisations looking to Increase quality and productivity across software delivery.
Why visual modelling is a game changer
Visual modelling represents a transformative shift in how teams approach test data generation and coverage. One of its most significant advantages is its ability to accelerate the identification of data gaps. Unlike manual data creation methods, which can be time-consuming and prone to oversights, visual models provide a holistic view of the syste. This allows teams to spot missing or under-represented scenarios quickly, ensuring that no edge cases or critical paths are missed. The visual nature of this method makes it easier to identify complex interactions between system components, which are often overlooked in traditional approaches.
By automating the creation of test data, visual modelling also reduces dependency on production data, which is often repetitive and lacks the diversity needed for comprehensive testing. Relying on production data alone can slow down teams, as they wait for the right data to be available or struggle to generate edge cases manually. Visual modelling, in contrast, enables teams to generate rich, diverse datasets tailored to their specific needs, without depending on the limitations of what already exists in production. This significantly speeds up the delivery process, as automated data provisioning ensures that relevant test data is always available when needed, eliminating bottlenecks caused by data preparation delays.
Additionally, visual modelling is enhanced by AI-driven techniques, which further expand data coverage through the use of equivalence classes and intelligent data generation. AI can analyse the visual models to automatically create a wide range of data scenarios that reflect the system’s full functionality, including edge cases that might be too complex to identify manually. As a result, teams can achieve more comprehensive coverage with less manual effort, making visual modelling not only a game changer in terms of efficiency but also in terms of the depth and breadth of test data it can provide.
Comprehensive data coverage
Achieving comprehensive data coverage is critical for ensuring the quality and productivity across software delivery. Inadequate coverage leaves significant gaps that can lead to bugs, system failures, and costly rework down the line. Without covering a full spectrum of scenarios—from common use cases to edge cases and unexpected conditions—teams are left with incomplete insights, which hampers both quality and productivity. The risks of poor data coverage are especially evident when teams spend too much time manually creating or waiting for data, slowing down the entire delivery process.
Visual modelling provides a scalable, efficient solution to this problem. By automating the creation of diverse, real-world data scenarios, visual modelling ensures that even the most complex systems have comprehensive data coverage. It reduces reliance on repetitive production data and accelerates testing, allowing teams to focus on more critical tasks. Organizations that prioritize data coverage using advanced techniques like visual modelling can significantly improve software quality, reduce rework, and speed up delivery cycles.
Curiosity Software's Enterprise Test Data platform, featuring powerful visual modelling capabilities, is designed to help you achieve high data coverage. Take the next step in optimizing your software delivery process with a solution that ensures your data covers all scenarios—enhancing both quality and productivity.
Turbocharge software delivery
Our outer loop experts will help you identify symptoms of inner/outer loop misalignment at your enterprise, crafting a roadmap to software delivery productivity and quality.